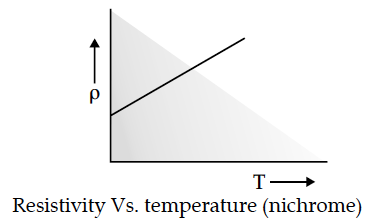
Draw a graph showing variation of resistivity with temperature for nichrome. Which property of nichrome is used to make standard resistance coils ?
At low temperature (or zero), the resistivity increases as a higher power of temperature. Then, it linearly increases with increase in temperature.


Plot a graph showing the variation of current I versus resistance R, connected to a cell of emf E and internal resistance r.
Draw a graph to show the variation of resistance of a metal wire as a function of its diameter keeping its length and material constant.
Give an example of a material each for which temperature coefficient of resistivity is:
(i) positive, (ii) negative.
How does one explain increase in resistivity of a metal with increase in temperature ?
How does the random motion of free electrons in a conductor get affected when a potential difference is applied across its ends ?
In the circuit shown in the figure, find the total resistance of the circuit and the current in the arm CD.
Two metallic wires P₁ and P₂ of the same material and same length but different cross-sectional areas A₁ and A₂ are joined together and then connected to a source of emf. Find the ratio of the drift velocities of free electrons in the wires P₁ and P₂ if the wires are connected
(i) in series, and (ii) in parallel.
An alternating voltage E = E₀ sin ωt is applied to the circuit containing a resistor R connected in series with a black box. The current in the circuit is found to be I=I₀ (sin ωt+π/4)
In a series LCR circuit, obtain the conditions under which
(i) the impedance of the circuit is minimum, and
(ii) wattless current flows in the circuit.
The figure shows a plot of terminal voltage ‘V’ versus the current ‘i’ of a given cell. Calculate from the graph
(i) emf of the cell and (ii) internal resistance of the cell.
N spherical droplets, each of radius r, have been charged to have a potential V each. If all these droplets were to coalesce to form a single large drop, what would be the potential of this large drop ?
(It is given that the capacitance of a sphere of radius x equals
The figure shows two sinusoidal curves representing oscillating supply voltage and current in an ac circuit.
