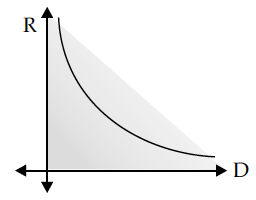
Draw a graph to show the variation of resistance of a metal wire as a function of its diameter keeping its length and material constant.

Plot a graph showing the variation of current I versus resistance R, connected to a cell of emf E and internal resistance r.
Draw a graph showing variation of resistivity with temperature for nichrome. Which property of nichrome is used to make standard resistance coils ?
How does one explain increase in resistivity of a metal with increase in temperature ?
In the circuit shown in the figure, find the total resistance of the circuit and the current in the arm CD.
What is relaxation time ? Derive an expression for resistivity of a wire in terms of number density of free electrons and relaxation time.
A device ‘X’ is connected to an ac source V = V₀ sin(ωt). The variation of voltage, current and power in one complete cycle is shown in the following figure.
(i) Which curve shows power consumption over a full cycle?
(ii) Identify the device ‘X’.
For an ideal conductor, connected across a sinusoidal ac voltage source. State which one of the following quantity is zero :
(i) Instantaneous power
(ii) Average power over full cycle of the ac voltage source.
How does the random motion of free electrons in a conductor get affected when a potential difference is applied across its ends ?
Nichrome and copper wires of same length and same radius are connected in series. Current I is passed through them. Which wire gets heated up more ? Justify your answer.
Why should electrostatic field be zero inside a conductor ?
A point charge Q is placed at point ‘O’ as shown in figure. Is the potential at point A, i.e., , greater, smaller or equal to potential, at point B, when Q is (i) positive, and (ii) negative charge?
Graph showing the variation of current versus voltage for a material GaAs is shown in the figure, identify the region of :
