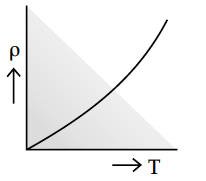
Show variation of resistivity of copper as a function of temperature in a graph.

How does one explain increase in resistivity of a metal with increase in temperature ?
Calculate the current drawn from the battery by the network of resistors shown in the figure.
For an ideal conductor, connected across a sinusoidal ac voltage source. State which one of the following quantity is zero :
(i) Instantaneous power
(ii) Average power over full cycle of the ac voltage source.
A device ‘X’ is connected to an ac source V = V₀ sin(ωt). The variation of voltage, current and power in one complete cycle is shown in the following figure.
(i) Which curve shows power consumption over a full cycle?
(ii) Identify the device ‘X’.
Nichrome and copper wires of same length and same radius are connected in series. Current I is passed through them. Which wire gets heated up more ? Justify your answer.
Why must electrostatic field at the surface of a charged conductor be normal to the surface at every point ? Give reason.
Give an example of a material each for which temperature coefficient of resistivity is:
(i) positive, (ii) negative.
What is the value of the angle between the vectors and for which the potential energy of an electric dipole of dipole moment , kept in an external electric field , has the maximum value.
What is the amount of work done in moving a point charge around a circular arc of radius r at the center where another point charge is located ?
