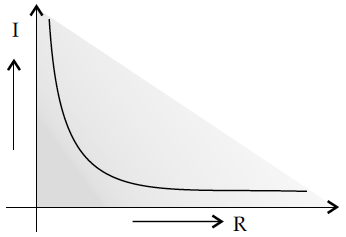
Plot a graph showing the variation of current I versus resistance R, connected to a cell of emf E and internal resistance r.


Draw a graph to show the variation of resistance of a metal wire as a function of its diameter keeping its length and material constant.
In the circuit shown in the figure, find the total resistance of the circuit and the current in the arm CD.
Draw a graph showing variation of resistivity with temperature for nichrome. Which property of nichrome is used to make standard resistance coils ?
How does one explain increase in resistivity of a metal with increase in temperature ?
Write the expression for the drift velocity of charge carriers in a conductor of length l across which a potential difference V is applied.
Nichrome and copper wires of same length and same radius are connected in series. Current I is passed through them. Which wire gets heated up more ? Justify your answer.
The emf of a cell is always greater than its terminal voltage. Why ? Give reason.
Two point charges ‘q1’ and ‘q2’ are placed at a distance ‘d’ apart as shown in the figure. The electric field intensity is zero at a point ‘P’ on the line joining them as shown. Write two conclusions that you can draw from this.
How does the random motion of free electrons in a conductor get affected when a potential difference is applied across its ends ?
Figure shows a point charge + Q, located at a distance R/2 from the centre of a spherical metal shell. Draw the electric field lines for the given system.
